In today's world full of microservices, gaining observability into the messages sent between services is critical to understanding and troubleshooting issues.
Unfortunately, tracing HTTP/2 is complicated by HPACK, HTTP/2’s dedicated header compression algorithm. While HPACK helps increase the efficiency of HTTP/2 over HTTP/1, its stateful algorithm sometimes renders typical network tracers ineffective. This means tools like Wireshark can't always decode the clear text HTTP/2 headers from the network traffic.
Fortunately, by using eBPF uprobes, it’s possible to trace the traffic before it gets compressed, so that you can actually debug your HTTP/2 (or gRPC) applications.
This post will answer the following questions
- When will Wireshark fail to decode HTTP/2 headers?
- Why does HPACK complicate header decoding?
- How can eBPF uprobes solve the HPACK issue?
as well as share a demo project showing how to trace HTTP/2 messages with eBPF uprobes.
Wireshark is a well-known network sniffing tool that can capture HTTP/2. However, Wireshark sometimes fails to decode the HTTP/2 headers. Let’s see this in action.
If we launch Wireshark before we start our gRPC demo application, we see captured HTTP/2 messages in Wireshark:

Wireshark captured HTTP/2 HEADERS frame.
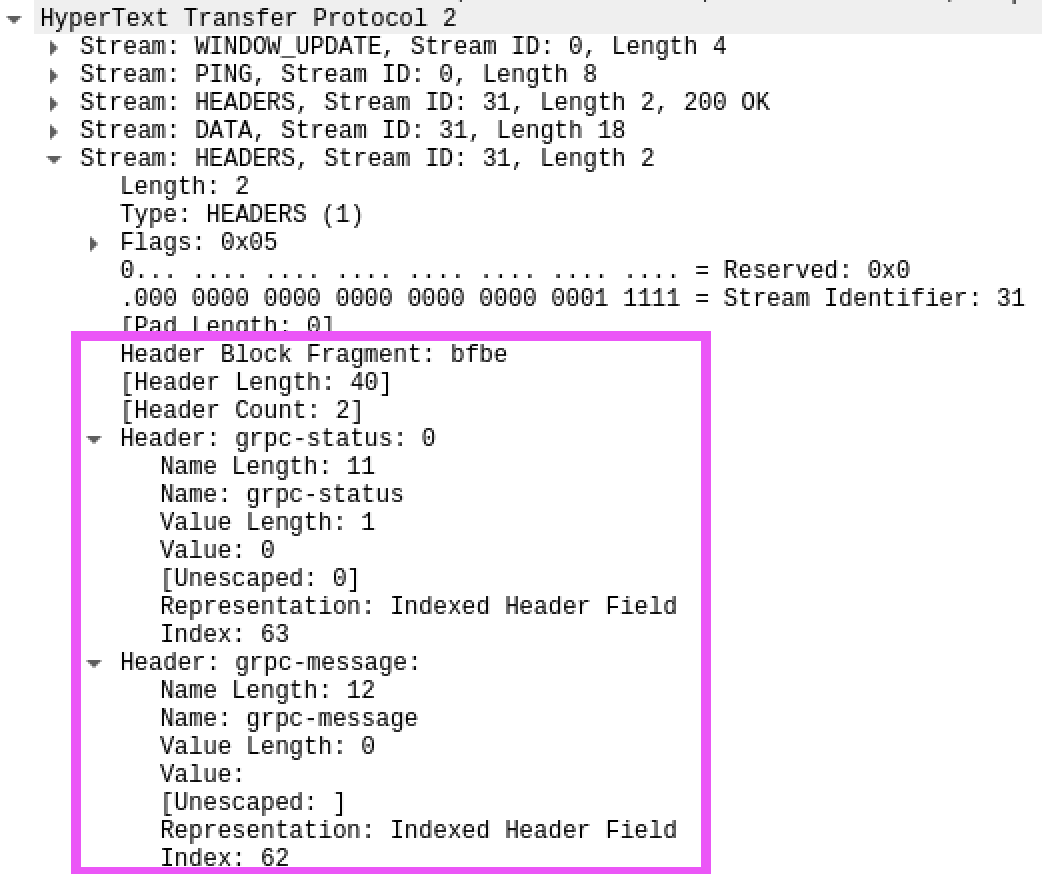
Let’s focus on the HEADERS frame, which is equivalent to the headers in HTTP 1.x, and records metadata about the HTTP/2 session. We can see that one particular HTTP/2 header block fragment has the raw bytes bfbe. In this case, the raw bytes encode the grpc-status and grpc-message headers. These are decoded correctly by Wireshark as follows:

Wireshark is able to decode HTTP/2 HEADERS if launched before the message stream starts.
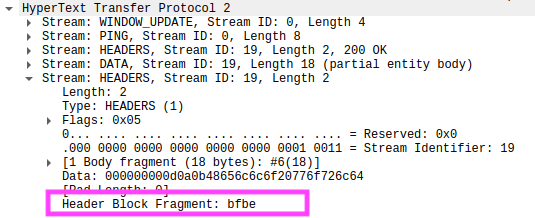
Next, let’s launch Wireshark after launching gRPC client & server. The same messages are captured, but the raw bytes can no longer be decoded by Wireshark:

Wireshark cannot decode HTTP/2 HEADERS if launched after the message stream starts.
Here, we can see that the Header Block Fragment still shows the same raw bytes, but the clear-text headers cannot be decoded.
To replicate the experiment for yourself, follow the directions here.
Why can’t Wireshark decode HTTP/2 headers if it is launched after our gRPC application starts transmitting messages?
It turns out that HTTP/2 uses HPACK to encode & decoder headers, which compresses the headers and greatly improves the efficiency over HTTP 1.x.
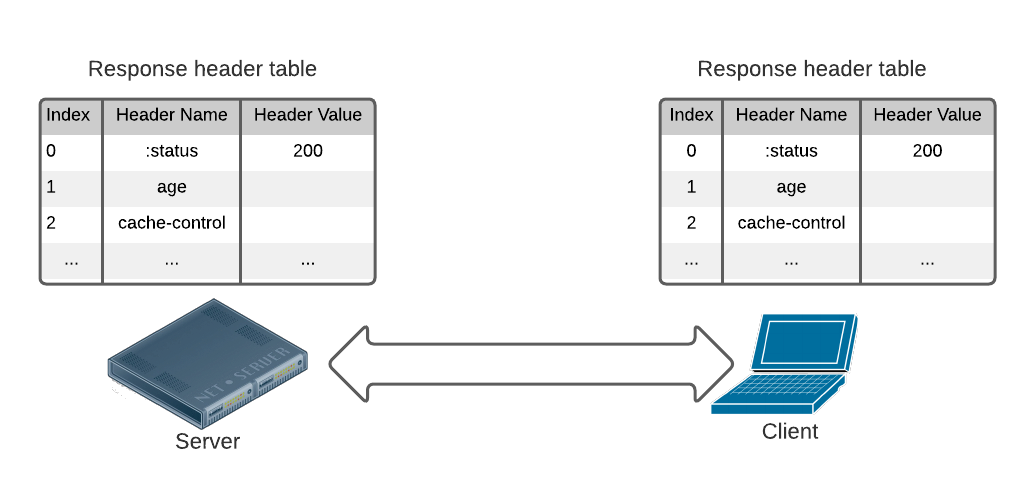
HPACK works by maintaining identical lookup tables at the server and client. Headers and/or their values are replaced with their indices in these lookup tables. Because most of the headers are repetitively transmitted, they are replaced by indices that use much less bytes than clear-text headers. HPACK therefore uses significantly less network bandwidth. This effect is amplified by the fact that multiple HTTP/2 sessions can multiplex over the same connection.
The figure below illustrates the table maintained by the client and server for response headers. New header name and value pairs are appended into the table, displacing the old entries if the size of the lookup tables reaches its limit. When encoding, the clear text headers are replaced by their indices in the table. For more info, take a look at the official RFC.

HTTP/2’s HPACK compression algorithm requires that the client and server maintain identical lookup tables to decode the headers. This makes decoding HTTP/2 headers difficult for tracers that don’t have access to this state.
With this knowledge, the results of the Wireshark experiment above can be explained clearly. When Wireshark is launched before starting the application, the entire history of the headers are recorded, such that Wireshark can reproduce the exact same header tables.
When Wireshark is launched after starting the application, the initial HTTP/2 frames are lost, such that the later encoded bytes bebf have no corresponding entries in the lookup tables. Wireshark therefore cannot decode the corresponding headers.
HTTP/2 headers are metadata of the HTTP/2 connection. These headers are critical information for debugging microservices. For example, :path contains the resource being requested; content-type is required to detect gRPC messages, and then apply protobuf parsing; and grpc-status is required to determine the success of a gRPC call. Without this information, HTTP/2 tracing loses the majority of its value.
So if we can’t properly decode HTTP/2 traffic without knowing the state, what can we do?
Fortunately, eBPF technology makes it possible for us to probe into HTTP/2 implementation to get the information that we need, without requiring state.
Specifically, eBPF uprobes address the HPACK issue by directly tracing clear-text data from application memory. By attaching uprobes to the HTTP/2 library APIs that take clear-text headers as input, the uprobes are able to directly read the header content from application memory before they are compressed with HPACK.
An earlier blog post on eBPF shows how to implement an uprobe tracer for HTTP applications written in Golang. The first step is to identify the function to attach BPF probes. The function’s arguments need to contain the information we are interested in. The arguments ideally should also have simple structure, such that accessing them in BPF code is easy (through manual pointer chasing). And the function needs to be stable, such that the probes work for a wide range of versions.
Through investigation of the source code of Golang’s gRPC library, we identified loopyWriter.writeHeader() as an ideal tracepoint. This function accepts clear text header fields and sends them into the internal buffer. The function signature and the arguments’ type definition is stable, and has not been changed since 2018.
Now the challenge is to figure out the memory layout of the data structure, and write the BPF code to read the data at the correct memory addresses.
Let’s take a look at the the signature of the function:
func (l *loopyWriter) writeHeader(streamID uint32, endStream bool, hf []hpack.HeaderField, onWrite func())
The task is to read the content of the 3rd argument hf, which is a slice of HeaderField. We use the dlv debugger to figure out the offset of nested data elements, and the results are shown in http2-tracing/uprobe_trace/bpf_program.go.
This code performs 3 tasks:
probe_loopy_writer_write_header() obtains a pointer to the HeaderField objects held in the slice. A slice resides in memory as a 3-tuple of {pointer, size, capacity}, where the BPF code reads the pointer and size of certain offsets from the SP pointer.
submit_headers() navigates the list of HeaderField objects through the pointer, by incrementing the pointer with the size of the HeaderField object.
For each HeaderField object, copy_header_field() copies its content to the output perf buffer. HeaderField is a struct of 2 string objects. Moreover, each string object resides in memory as a 2-tuple of {pointer, size}, where the BPF code copies the corresponding number of bytes from the pointer.
Let’s run the uprobe HTTP/2 tracer, then start up the gRPC client and server. Note that this tracer works even if the tracer was launched after the connection between the gRPC client and server are established.
Now we see the headers of the response sent from the gRPC server to client:
[name=':status' value='200'][name='content-type' value='application/grpc'][name='grpc-status' value='0'][name='grpc-message' value='']
We also implemented a probe on google.golang.org/grpc/internal/transport.(*http2Server).operateHeaders() in probe_http2_server_operate_headers(); which traces the incoming headers received at the gRPC server.
This allows us to see the headers of the requests received by the gRPC server from client:
[name=':method' value='POST'][name=':scheme' value='http'][name=':path' value='/greet.Greeter/SayHello'][name=':authority' value='localhost:50051'][name='content-type' value='application/grpc'][name='user-agent' value='grpc-go/1.43.0'][name='te' value='trailers'][name='grpc-timeout' value='9933133n']
Productionizing this uprobe-based tracer requires further consideration, which you can read about in the footnotes. To try out this demo, check out the instructions here.
Tracing HTTP/2 traffic is made difficult because of the HPACK header compression algorithm. This post demonstrated an alternative approach to capturing the messages by directly tracing the appropriate functions in the HTTP/2 library using eBPF uprobes.
It is important to understand that this approach comes with pros and cons. The main advantage is the ability to trace messages regardless of when the tracer was deployed. A significant disadvantage, however, is that the approach is specific to a single HTTP/2 library (in this case Golang’s library); this exercise would have to be repeated for other libraries, and there is potential maintenance required if the upstream code ever changes. In the future, we are considering contributing USDTs to the libraries which would give us more stable tracepoints and mitigate some of the disadvantages of the uprobes. In the end, our goal was to optimize for an approach that worked out of the box, regardless of the deployment order, which is what led us to the eBPF uprobe-based approach.
Looking for the demo code? Find it here.
Questions? Find us on Slack or Twitter at @pixie_run.
This demo project only traces HTTP/2 headers, not the data frames. To trace the data frame, you’d need to identify the Golang
net/http2library function that accepts the data frame as an argument and figure out the memory layout of the relevant data structures. For an example implementation, take a look at Pixie’s code.The uprobe BPF code memory layout is hard-coded. This code will break if the memory layout of data structures is changed between Golang versions. This can be solved by querying the DWARF information bundled with the executable. For an example implementation, take a look at Pixie’s DWARF query APIs.
The existing BPF code relies on Golang’s stack-based calling convention, which will break in Golang 1.17 and newer versions’ register-based calling convention. The Pixie team is working on a new framework for this. For updates, follow this GitHub issue.
Terms of Service|Privacy Policy
We are a Cloud Native Computing Foundation sandbox project.
Pixie was originally created and contributed by New Relic, Inc.
Copyright © 2018 - The Pixie Authors. All Rights Reserved. | Content distributed under CC BY 4.0.
The Linux Foundation has registered trademarks and uses trademarks. For a list of trademarks of The Linux Foundation, please see our Trademark Usage Page.
Pixie was originally created and contributed by New Relic, Inc.


